When opening PeopleSoft ExcelToCI tool we can see it is actually an Excel workbook containing 5 different spreadsheets.
The first one, called "Coversheet", is only used as a summary or quick guide of the tool.
So, in order to start working with this PeopleSoft tool, we must go to the second sheet, called "Connect Information".
In this sheet it is defined all the information we are going to use to connect our workbook with PeopleSoft.
Most important ones are:
Connection Information: You should be able to obtain this data from the PIA URL:

URL:
Web Server: psoft.company.com
Protocol: HTTP
HTTP Port: 8050 (if no port specified then likely to be 80)
Portal: EMPLOYEE
PeopleSoft Site: PSPRD (Case sensitive)
Node: PT_LOCAL
Language Code: ENG
Chunking Factor: 40
Web Server Machine Name: The name of the PeopleSoft web server to connect to
Protocol: The protocol used to access the web server.
HTTP Port: The port number that the web server uses
Portal: The name of the portal
PeopleSoft Site Name: The name of the PeopleSoft site.
Node: The PeopleSoft node.
Language Code: The code for the language used in the data to be submitted to the database
Chunking Factor: The number of rows of data to be uploaded to the database at given time
Chunking Factor: You can think it as the quantity of lines you want to work with at the same time when sending information to the database. In this case I've chosen 7, meaning the tool will process 7 rows at a time.
Error Threshold: Each line at the level 0 of the component implies an execution of the PeopleSoft Component Interface behind this tools. So, If I'm going to process several lines, I've several chances of making Component Interface get to an error.
With this variable I am able to set to the ExcelToCI tool an error range before aborting its flow. If you want to be very strict you may set this variable to 0, so the first time the ExcelToCI gets an error it will stop processing the rest of the lines.
On the other side, if you are working with a simple Component Interface you might not give much importance to an error line, since each line is independent from the other ones and you want to process the most lines at a while. In this case you should set a high "Error Threshold" number.
Then, when the ExcelToCI flows is ended, you could take a look to the error lines and fixed them before processing them once again.
Once we have this information set, we must go to the "Template" sheet.
In this sheet we will start working with ExcelToCI "Add-Ins"
The first one is "New Template". This add-in will let us generate a new tempalte based on a PeopleSoft Component Interface.
When clicking to that button, the following windows appears. There we have to enter our user and password to access PeopleSoft. Besides we have to add the name of the Component Interface we will be working with.
Once it is loaded, in the same sheet we can see all the Component Interface structure displayed as columns. It is also shown some specifications for each property.
1) Which Component Interface Collection is the owner of the property.
2) The name of the current property.
3) Record Type: We should take this property as the "Buffer Level". In this case it will always be 0, since it is a very simple component.
4) Field type, field length, Key or not, Required or not, sequence in the Component Interface
At the end, we could see (below highlighted in red) each column label and "a grey row" just below. This are the lines which we'll be working with.
Now, the rest of the "Add-ins" start to be useful.
If we stay in one cell and click the “Select Input Cell” option, the cell will be marked in a light orange colour. At this way, the ExcelToCI knows this column will be available for users to insert data in the final template.
If we want to set more than one cell at a time, we'll be able to do this by selecting them and choosing “Select All Input Cells”
Thus, the ExcelToCI tool will set all the cells as available for user inputs.
On the other side, if we are pretending to avoid users inserting any property, we could then hide that cell by selecting it and choosing the “Do Not Include For Submission” option. This option will set the cell back to gray colour and hide it from user template.For instance, in my example I'm not using the name column, so I'll hide it.
Once we have our template set, we can go to the next step by clicking the “New Data Input” option.
At this time we will sent to the "Data Input" sheet.
In this sheet we are going to fill all the data we want to process. As you could see below, the "Name" column is not displayed at this time.
I'll add some information (sorry for hiding some data, I've created this tutorial for some mates and I must hide it because of privacy purposes).
If you notice, rows at the first column are equals in every rows.
If we are sure a column will allways have the same "fixed value" (for instance if we have a button in our PeopleSoft Component Interface and we want to click it by using PeopleCode) we can set this fixed value in the previous sheet, "Template".
In this case I'll add a fixed value to the SETID column since I know all my vendors will belong to that one.
Now I can select that cell and choose the "Deselect Input Cell" option which let us indicate to the ExcelToCi tool we won't have this column visible in the "Data Input" section.
In this case, the cell will be painted in a light blue colour, showing it is not able for users to input data but it will be taken into account when posting data to PeopleSoft.
Another way of making this configuration is by click the "Include for Submission" option.
I'll set this change back, just to continue with our example.
Now I generate the "Data Input" once again.
ExcelToCi alerts me previous data will be erased since the tempalte has changed:
An the new Data Input is not showing the Setid column.
I'll set all the values, but in this case I'll add some errors in when adding mails.
With this information, I can go to the next step by clicking the "Stage Data for Submision" option.
This option will take all the information we've previously added and prepare it to be sent to the PeopleSoft Component Interface, leading us to the last sheet “Staging & Submission”.
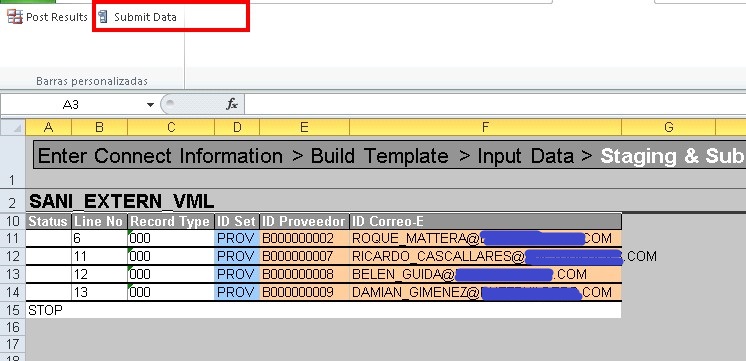
In this sheet we are able to see a summary of all the steps we've been taking.
You can see there are all different lines, containing "Level 0" records.
Those lines are all related to a SETID we have set at the Template sheet and contains the information we have added at the "Data Input" page.
Once we took a second look to confirm everything is properly filled, we choose the "Submit Data" option to send information to PeopleSoft.
We are once again asked for adding our connection information.
In this case we are only asked for adding user and password, since the Component Interface was previously set, but ExcelToCI wants to confirm we have access to process information with the chosen Component Interface.
At this point, ExcelToCI starts processing all the information and, in case the "Error Threshold" is exceeded the process will be stopped.
On the other side, we can see lines that were properly processed are marked by a GREEN cell at the beggining of the row, where as the error ones are marked by a RED cell.
We could finally see there are 2 lines having no marks. this is because those lines were not processed yet.
This is the result of the configuration we've previously made.
The ExcelToCI tool has taken the first 7 lines and worked with them as a single block.
5 lines were properly processed where as 2 lines failed. Since the Error Threshold was set to 1, then the ExcelToCI tool process has ceased.
If we now take a look at the database, we will see new 5 lines were added to our table in peoplesoft as a result of the Component Interface process.
On the other side, if we "hover" the mouse in a Error cell, a pop up message is shown detailing the error that was caused when processing that line.
In order to fix those errors and continue processing the lines we have to choose the "Post Results" options.
At this time, the ExcelToCI tool will update the "Input Data" sheet with the execution results so we'll be allowed to change any data.
Once we fix all the values we choose the "Stage Data For Submission" option once again.
ExcelToCI tool will lead us once again to the last sheet. At this point, only pending lines are shown.
Let's click once again in "Submit Data" option.
I'm asked for credentials once again.
And now the rest of the rows are properly processed:
If we now take a second look to the database, we can confirm all the lines are now inserted in our table.