- As a PeopleSoft technical developer working with PS-Queries ever wondered how to monitor PS-Query performance?
- How to cancel/kill a currently running PS-Query?
- How to see the currently running PS-Queries?
- How to see the average run-time of a query?
- How and where to find the frequency of a query being run and its last run date?
- Which record keeps track of PS-Query run statistics?
- Whether these stats are captured for scheduled queries and queries run from 2 and 3 tiers?
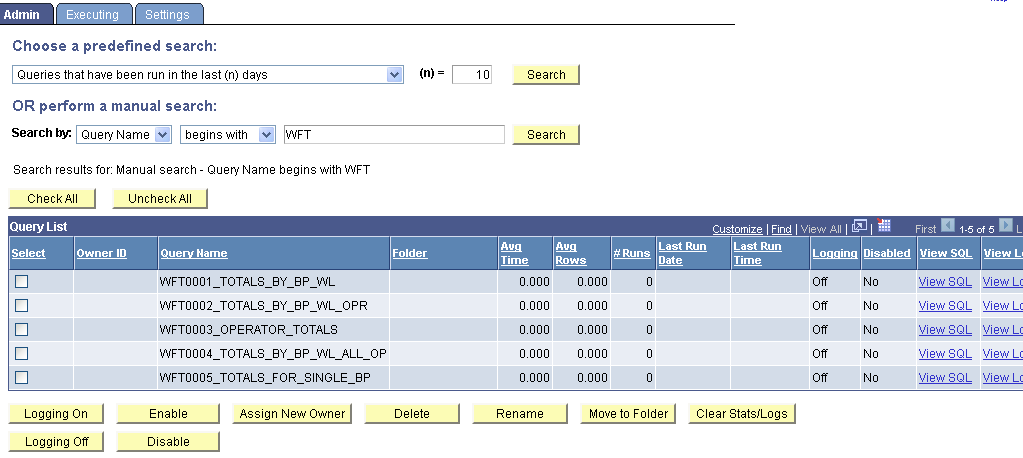
1. PeopleTools > Utilities > Administration > Query Administration > Admin
This page allows selection by:
- Queries that belong to locked out accounts.
- Queries that have been disabled.
- Queries that have been run in the last (n) days.
- Queries that have logging turned on.
- Queries that have never been run.
- Queries that have run but not in the last (n) days.
- Top (n) queries by largest average number of rows.
- Top (n) queries by longest run time.
- Top (n) queries most frequently run.
The following details and statistics get displayed for each query returned by the above selection:
Owner ID, Query name, Folder, Average time the query has ran, Average number of rows fetched by the query, Number of runs, Last run date and time of the query along with Logging and Disabled statuses, links to View SQL and Log are displayed.
Unsaved queries which are run appear as <UNTITLED>. If there are multiple queries unsaved and ran, they all uppear as a single UNTITLED query. Any attempt to perform action on these Untitled queries could result in some error.
Additional buttons available in the Query Administration page are:
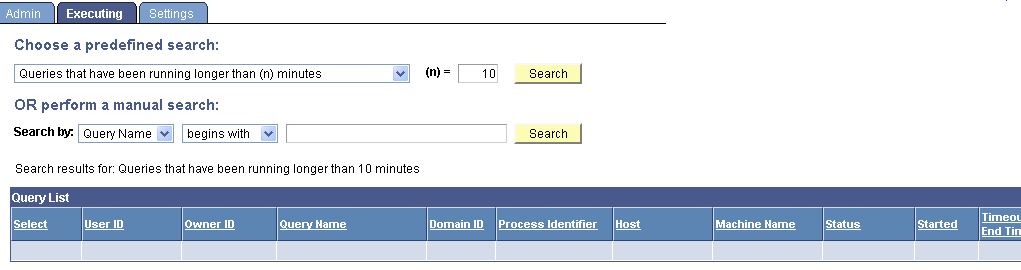
2. PeopleTools > Utilities > Administration > Query Administration > Executing
PSQRYEXECLOG Table:
Additional buttons available in the Query Administration page are:
- Logging On and Off buttons
- Enable and Disable buttons allowing or restricting the selected query to be run, previewed or scheduled
- Assign New Owner
- Delete
- Rename,
- Move to Folder and
- Clear Stats/Logs
Important points on Statistics:
- The statistics log is updated with data only if the query runs to completion.
- The statistics can be cleared only for Untitled queries.
- Workflow queries are excluded from the statistics.
2. PeopleTools > Utilities > Administration > Query Administration > Executing
This Executing page displays all the currently running queries, providing options to enable or disable queries, enable or disable logging, and to cancel currently running queries.
The following statistics gets displayed:
User Id, Owner ID, Query name, Domain ID, Process identifier, Host and Machine names, Status, Time started, Time-out end time, Number of times killed, Logging and Disabled statuses.
PSQRYTRANS Table:
For every PS-Query run from either the Query Manager or Query Viewer a row is added to the PSQRYTRANS table. Query Monitor, which implements the kill query/time-out functionality, has a mechanism that looks for orphan rows in PSQRYTRANS. Orphan rows in PSQRYTRANS table represent queries that are not actively running. Orphan rows can be created because the server crashed while running a query, or due to other reasons.
For every PS-Query run from either the Query Manager or Query Viewer a row is added to the PSQRYTRANS table. Query Monitor, which implements the kill query/time-out functionality, has a mechanism that looks for orphan rows in PSQRYTRANS. Orphan rows in PSQRYTRANS table represent queries that are not actively running. Orphan rows can be created because the server crashed while running a query, or due to other reasons.
Query Monitor looks for orphan rows only for the application server domain that it is running in. For this reason, orphan rows could be in PSQRYTRANS record when no active domain is present. These rows are not seen by the online query monitoring facility, but could potentially exist in the database. Such rows are rare, and using the database query tool they can be cleaned up. The machine and domain fields can be used to determine whether rows exist and if that should be cleaned up.
PSQRYEXECLOG Table:
Alternatively one could also look upon PSQRYEXECLOG table which keeps track of the queries executed.
However, PSQRYEXECLOG table does not capture data for PS-Queries run from Client PSQuery 2-tier and 3-tier. Even if there are statistics recorded in PSQRYEXECLOG they may not be complete and the reason why they could be captured is because some user could have used the PIA Query Administration Page to change a Query Field value EXECLOGGING in the PSQRYDEFN Table.
This is because PSQRYEXECLOG record is designed for running Query in PIA (4-tier) only, and not designed to be used by 2 or 3-tier Query. For this reason, all statistic results from 2 or 3-tier Query should be discarded.
What happens when a query is killed?
3. PeopleTools > Utilities > Administration > Query Administration > Settings
There are couple of additional settings in the above navigation:
However, PSQRYEXECLOG table does not capture data for PS-Queries run from Client PSQuery 2-tier and 3-tier. Even if there are statistics recorded in PSQRYEXECLOG they may not be complete and the reason why they could be captured is because some user could have used the PIA Query Administration Page to change a Query Field value EXECLOGGING in the PSQRYDEFN Table.
This is because PSQRYEXECLOG record is designed for running Query in PIA (4-tier) only, and not designed to be used by 2 or 3-tier Query. For this reason, all statistic results from 2 or 3-tier Query should be discarded.
What happens when a query is killed?
- The NUMKILLS field in PSQRYSTATS record gets incremented, and this is also reflected in the query stats GUI.
- A new row gets written in the PSQRYEXECLOG record.
- In the PSQRYEXECLOG record, the field KILLEDREASON reflects why the query was killed. It takes in two values – 'T' for timed out and 'K' for killed.
- EXECDTTM field in PSQRYEXECLOG record is set to the time the query was killed. This is also reflected in the exec log GUI.
What is a Query Monitor?
- The query monitor is an appserver function which runs every minute to find out queries that have reached their time limit, or have been marked to be killed.
- The query monitor will check for orphaned rows – ie rows that have no timeout, and the appserver process doesn’t exist or isn’t running a query.
- As it finds a row to kill or timeout it will ensure that the process is really a PSAPPSRV or PSQRYSRV that is running a query.
How to check if a cancelled query has really got cancelled? In other words, how to verify that a query has got cancelled?
Take a look into the Appsrv.log file and verify that the PSMONITORSRV service has canceled the selected query.
Currently running scheduled queries cannot be canceled.
Take a look into the Appsrv.log file and verify that the PSMONITORSRV service has canceled the selected query.
Currently running scheduled queries cannot be canceled.
3. PeopleTools > Utilities > Administration > Query Administration > Settings
There are couple of additional settings in the above navigation:
- Enable Query Timeout - The timeout values are stored in each permission list. The value specified in the time out for every permission list represents the number of minutes that a query can run before being timed out. For specifying no time limit enter the number 0 which represents an infinite timeout value. The query timeout value that is used is the greatest number, or 0 if it exists, for all permission lists of all roles that a user belongs to.
- Run Query Statistics - PeopleSoft recommends to use this feature only for analysis, and leaving this feature enabled may compromise the performance and the system may have an increased possibility of query time-outs or may return query results with zero values.
Note:
- The query time-out feature applies to queries that are run in Query Manager and Query Viewer. This feature does not apply to scheduled queries.
- The QRYTIMEOUT field in PSQRYFLAGS table acts as a global flag that controls the enabling of the query timeout functionality.