In PeopleTools 8.4, PeopleSoft has started to introduce some utilities to help detect and identify performance problems in the online part of the application. This chapter discusses some aspects of these utilities.
This chapter does not seek to replace PeopleSoft’s documentation. Instead, you are advised to read this chapter in conjunction with PeopleBooks.
1UERY METRICS IN 0EOPLE4OOLS 8.4
In PeopleTools 8.4, PeopleSoft introduced two new methods of collecting query execution times: query statistics and query logging.
Query Statistics
Whenever a query is executed via the Pure Internet Architecture (PIA), the new average execution time, fetch time, and number of rows for that query across all executions are either inserted into or updated on the table PSQRYSTATS, as shown in Listing 10-1.
Listing 10-1. How PeopleSoft Updates Query Statistics
UPDATE PSQRYSTATS
SET AVGEXECTIME = (AVGEXECTIME * EXECCOUNT +
:4)/(EXECCOUNT + 1),
AVGFETCHTIME = (AVGFETCHTIME * EXECCOUNT +
:5)/(EXECCOUNT + 1),
AVGNUMROWS = (AVGNUMROWS * EXECCOUNT +
0)/(EXECCOUNT + 1),
LASTEXECDTTM = TO_DATE(SUBSTR(:3, 0,
19),'YYYY-MM-DD-HH24.MI.SS'),
EXECCOUNT=EXECCOUNT + 1 WHERE OPRID = :1
AND QRYNAME = :2
The limitation of this technique is that you can only see an average for a query since the averages were last deleted from the table. Query logging, described in the next section, provides information about each query execution.
The content of this table can be queried via the PeopleTools ⮞ Utilities ⮞ Administration ⮞ Query Administration component.
This example illustrates the fields and controls on the Admin page.
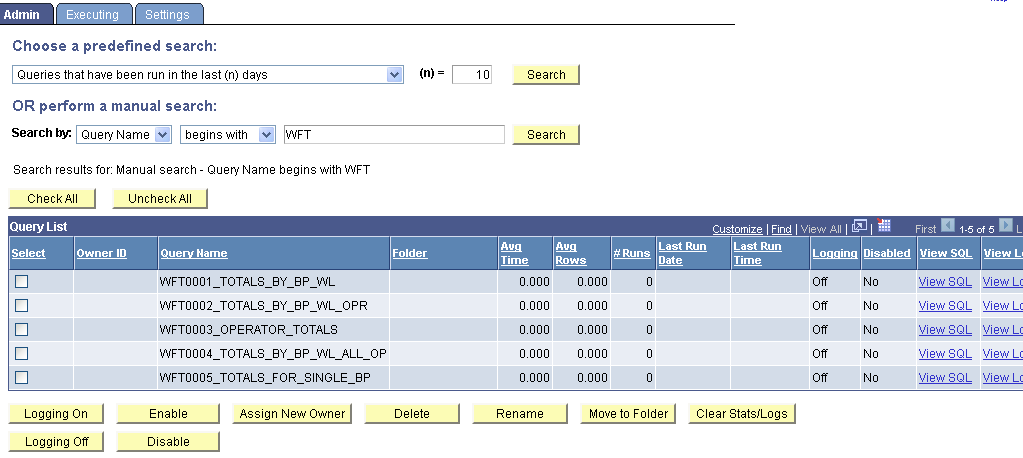
To administer queries:
Use either the predefined search or manual search option to restrict the list of queries that are displayed.
For a predefined search, enter the desired value for the selected search option in the (n)= field and select one of the following options:
Queries that belong to locked out accounts
Queries that have been disabled
Queries that have been run in the last (n) days
Queries that have logging turned on
Queries that have never been run
Queries that have run but not in the last (n) days
Top (n) queries by largest average number of rows
Top (n) queries by longest run time
Top (n) queries most frequently run
Although the component can list the top n queries by cumulative execution time, it does not calculate total execution time. Queries are listed by average rather than cumulative execution time. However, it is easy to query this table in SQL, as shown in Listing 10-2.
Listing 10-2. Top Ten Queries
by Cumulative Execution
Time (top10qry.sql)
SELECT * FROM (
SELECT RANK() OVER (ORDER BY tottime DESC ) as qryrank
, oprid, qryname, totexec, tottime
, 100*RATIO_TO_REPORT(tottime) OVER () as pcttime FROM (SELECT oprid, qryname
, SUM(execcount) totexec
, SUM(execcount*avgexectime) tottime FROM psqrystats
GROUP BY oprid, qryname
) a
)
WHERE qryrank <= 10
/
The results of the query are shown in Listing 10-3.
Listing 10-3. Top Queries by Cumulative Execution
Time (top10qry.lst)
QRYRANK OPRID QRYNAME TOTEXEC TOTTIME PCTTIME
|
1 |
DMKPUB |
|
4 |
|
2.8 |
|
51.3 |
|
2 PS |
DMK |
|
7 |
|
2.4 |
|
43.6 |
|
3 |
PER701 DEPT_TBL |
|
1 |
|
0.3 |
|
5.1 |
Use the Executing page (QRY_KILL) to cancel currently running queries, and enable or disable queries and logging.
Navigation
Image: Executing page
This example illustrates the fields and controls on the Executing page.
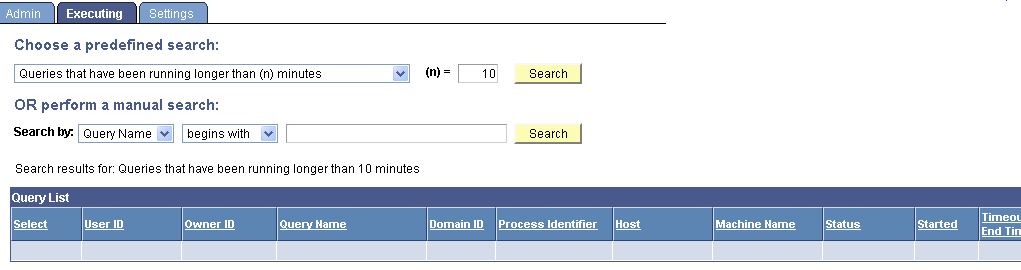
The Executing page displays all of the currently running queries, allowing you to enable or disable queries, enable or disable logging, and cancel currently running queries. If administrators needs to verify that a query has been canceled, they can look in the Appsrv.log and verify that the PSMONITORSRV service has canceled the selected query.
To manage currently running queries:
Use either the predefined search or manual search option to restrict the list of queries that are displayed.
For a predefined search, select one of the following options:
Queries that have been running longer than (n) minutes
Top (n) queries by longest run time
In the (n)= field, enter the value that you want for the search option.
For a manual search, select to search queries by query name or owner ID.
You can define your search further by selecting either the begins with or contains search type.
Click the Search button to display a list of queries that match your search criteria.
The Query List group box lists those queries that match your search criteria.
Review the following statistics for each query that is listed:
User ID
Owner ID
Query name
Domain ID
Process identifier
Host
Machine name
Status
Time started
Time-out end time
Number of times killed
Logging status
Disabled status
For the appropriate query, click the View Log link to view the log for that query.
A message appears if no logs are available.
For the appropriate query, click the View SQL link to view the SQL for that query.
Select the check box for each query on which you want to perform an action.
You can also click the Check All button to select all queries, or click the Uncheck All button to clear all queries.
Perform an action by clicking one of the following buttons:
Kill Selected Processes: Forces the selected query to stop running.
Logging On: Enables logging for the selected query.
When you enable logging, detailed statistics are logged on the query after every time it has run to completion. The statistics are stored in a separate Query Log table.
Logging Off: Disables logging for the selected query.
Enable: Enables the selected query to be run, previewed, or scheduled.
Disable: Disables the selected query from being run, previewed, or scheduled.
For the appropriate query, select the Logging check box to enable logging for that query.
Note: Your changes are saved automatically and the Save button is not available.
The kill query (cancel query or time-out) mechanism represents each query that is run from Query Manager or Query Viewer as a row in the table PSQRYTRANS. Query Monitor, which implements the time-out functionality, has a mechanism that looks for orphan rows in PSQRYTRANS. Orphan rows are rows in PSQRYTRANS that do not have a query actively running. Orphan rows can be created because the server crashed while running a query, or other reasons.
Query Monitor looks for orphan rows only for the application server domain that it is running in. For this reason, orphan rows could be in PSQRYTRANS when no active domain exists. These rows are not seen by the online query monitoring facility, but could potentially exist in the database. Such rows are rare and you can use the database query tool to clean them up. You can use the machine and domain fields to determine whether rows exist that should be cleaned up.


No comments:
Post a Comment