What is Salvage Value?
Using Salvage Value to Determine Depreciation
The estimated salvage value is deducted from the cost of the asset to determine the total depreciable amount of an asset.
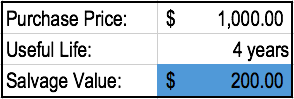
For example, Company A purchases a computer for $1,000. The company estimates that the computer’s useful life is 4 years. This means that the computer will be used by Company A for 4 years and then sold afterward. The company also estimates that they would be able to sell the computer at a salvage value of $200 at the end of 4 years. The company follows a straight-line depreciation method.
What is Straight Line Depreciation?
Straight Line Depreciation Formula
The straight line depreciation formula for an asset is as follows:

Where:
Cost of the asset is the purchase price of the asset
Salvage value is the value of the asset at the end of its useful life
Useful life of asset represents the number of periods/years in which the asset is expected to be used by the company.
Additionally, the straight line depreciation rate can be calculated as follows:

How to Calculate Straight Line Depreciation
The straight line calculation steps are:
- Determine the cost of the asset.
- Subtract the estimated salvage value of the asset from the cost of the asset to get the total depreciable amount.
- Determine the useful life of the asset.
- Divide the sum of step (2) by the number arrived at in step (3) to get the annual depreciation amount.
Straight Line Example
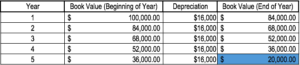
Company A purchases a machine for $100,000 with an estimated salvage value of $20,000 and a useful life of 5 years.
The straight line depreciation for the machine would be calculated as follows:
- Cost of the asset: $100,000
- Cost of the asset – Estimated salvage value: $100,000 – $20,000 = $80,000 total depreciable cost
- Useful life of the asset: 5 years
- Divide step (2) by step (3): $80,000 / 5 years = $16,000 annual depreciation amount
Therefore, Company A would depreciate the machine at the amount of $16,000 annually for 5 years.
The depreciation rate can also be calculated if the annual depreciation amount is known. The depreciation rate is the annual depreciation amount / total depreciable cost. In this case, the machine has a straight-line depreciation rate of $16,000 / $80,000 = 20%.
What Is Depreciation?
In accounting terms, depreciation is defined as the reduction of the recorded cost of a fixed asset in a systematic manner until the value of the asset becomes zero or negligible.
An example of fixed assets are buildings, furniture, office equipment, machinery etc. The land is the only exception that cannot be depreciated as the value of land appreciates with time.
Depreciation allows a portion of the cost of a fixed asset to the revenue generated by the fixed asset. This is mandatory under the matching principle as revenues are recorded with their associated expenses in the accounting period when the asset is in use. This helps in getting a complete picture of the revenue generation transaction.
1) Straight-line depreciation method
This is the simplest method of all. It involves the simple allocation of an even rate of depreciation every year over the useful life of the asset. The formula for straight-line depreciation is:
Annual Depreciation expense = (Asset cost – Residual Value) / Useful life of the asset
Example – Suppose a manufacturing company purchases machinery for Rs. 100,000 and the useful life of the machinery are 10 years and the residual value of the machinery is Rs. 20,000
Annual Depreciation expense = (100,000-20,000) / 10 = Rs. 8,000
2) Unit of Production method
This is a two-step process, unlike the straight-line method. Here, equal expense rates are assigned to each unit produced. This assignment makes the method very useful in assembly for production lines. Hence, the calculation is based on the output capability of the asset rather than the number of years.
The steps are:
Step 1: Calculate per unit depreciation:
Per unit Depreciation = (Asset cost – Residual value) / Useful life in units of production
Step 2: Calculate the total depreciation of actual units produced:
Total Depreciation Expense = Per Unit Depreciation * Units Produced
What is Net Book Value?
Net book value (NBV) refers to the historical value of a company’s assets or how the assets are recorded by the accountant. NBV is calculated using the asset’s original cost – how much it cost to acquire the asset – with the depreciation, depletion, or amortization of the asset being subtracted from the asset’s original cost.
Calculating Net Book Value
The formula for calculating NBV is as follows:
Net Book Value = Original Asset Cost – Accumulated Depreciation
Where:
Accumulated Depreciation = Per Year Depreciation x Total Number of Years
Sample Calculation of Net Book Value
Let’s put in the example of the logging truck mentioned above. If the logging company purchased the truck for $200,000 and the truck depreciated $15,000 per year for 4 years, the calculation of NBV would look like below:
Accumulated Depreciation = $15,000 x 4 years = $60,000
Net Book Value = $200,000 – $60,000 = $140,000
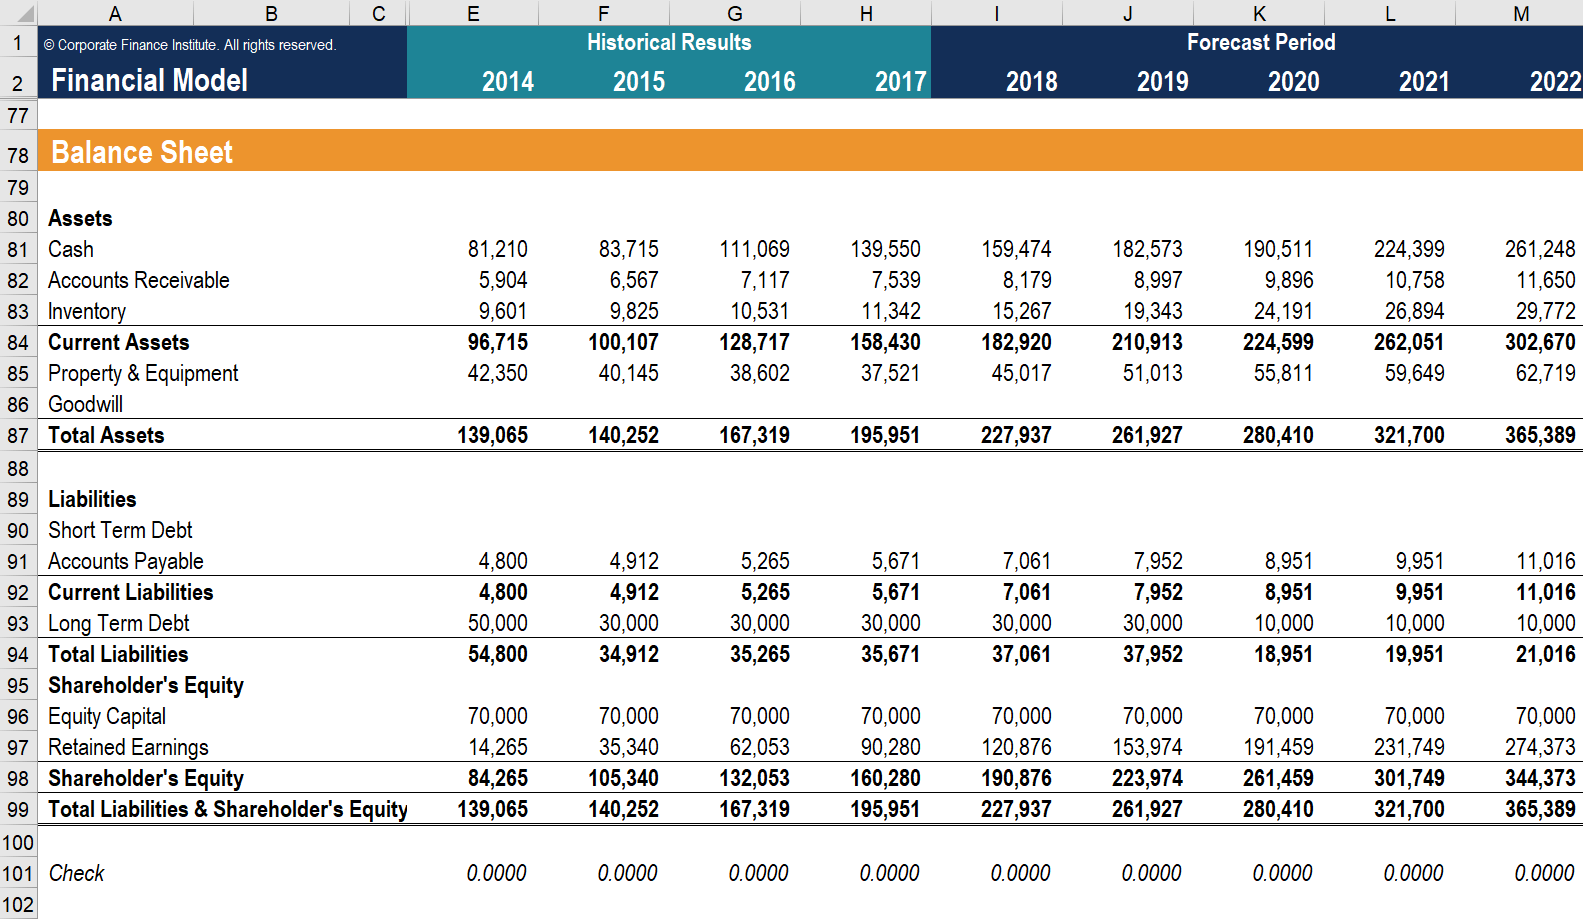
What is the Balance Sheet?
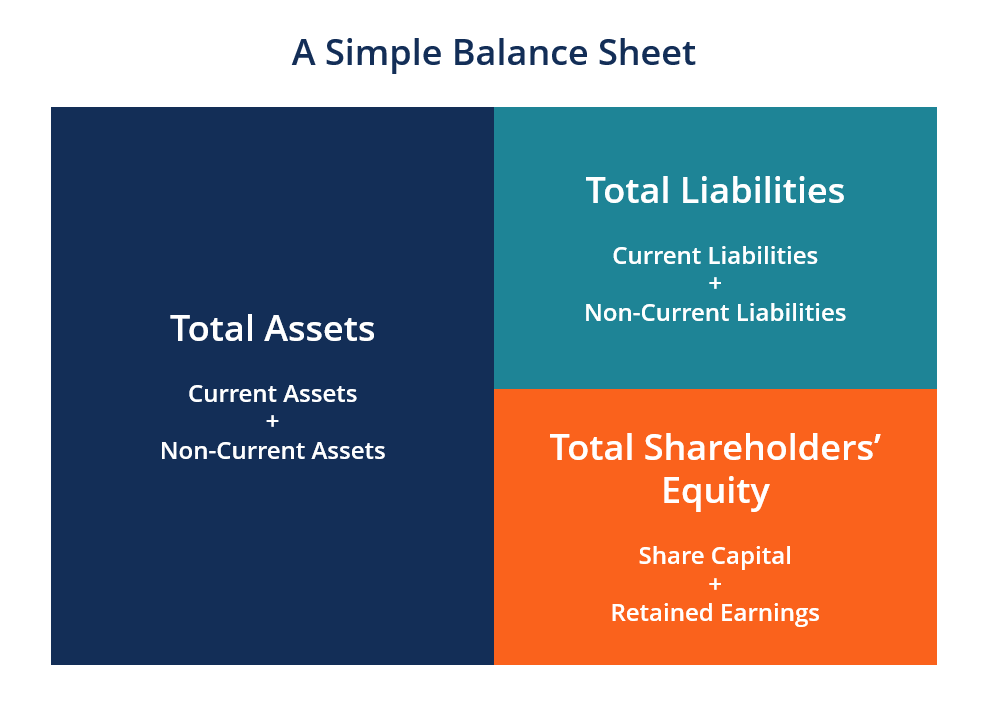
The balance sheet is one of the three fundamental financial statements and is key to both financial modeling and accounting. The balance sheet displays the company’s total assets and how the assets are financed, either through either debt or equity. It can also be referred to as a statement of net worth or a statement of financial position. The balance sheet is based on the fundamental equation: Assets = Liabilities + Equity
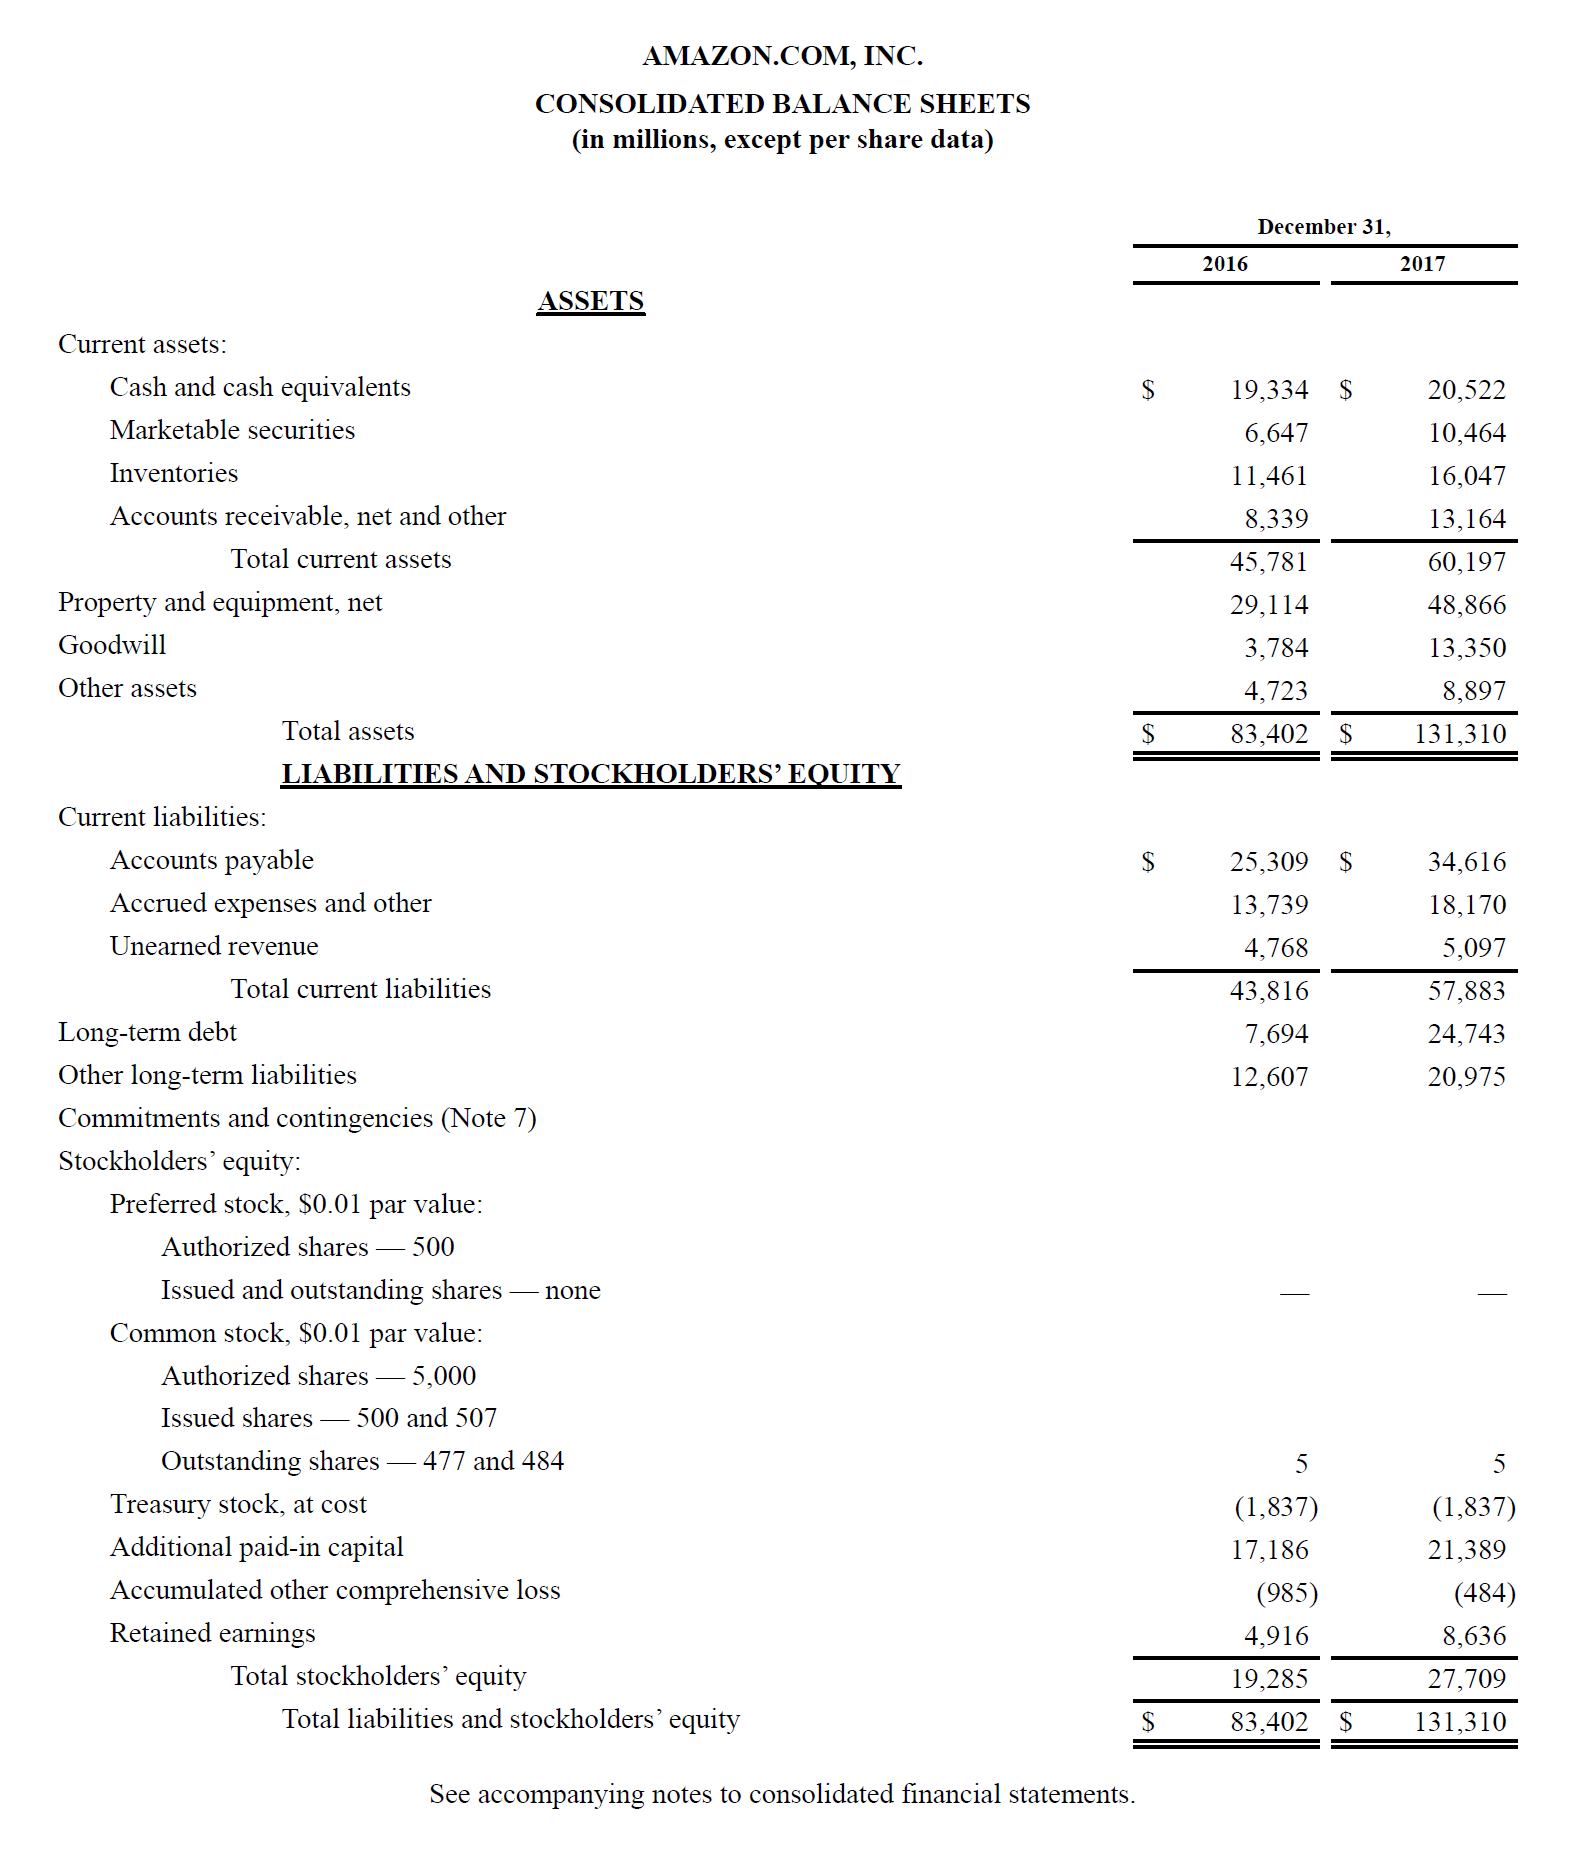
Balance Sheet Example
Below is an example of Amazon’s 2017 balance sheet taken from CFI’s Amazon Case Study Course. As you will see, it starts with current assets, then non-current assets, and total assets. Below that are liabilities and stockholders’ equity, which includes current liabilities, non-current liabilities, and finally shareholders’ equity.
 .
.
I
How is the Balance Sheet used in Financial Modeling?
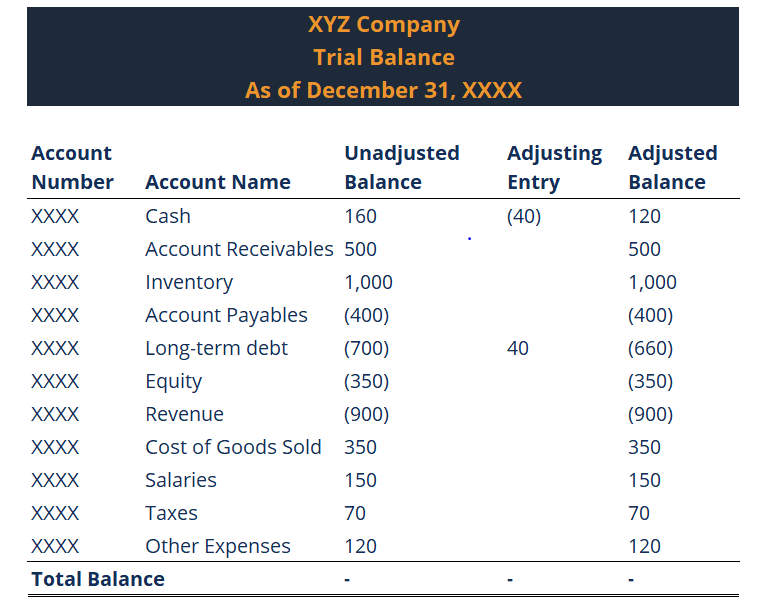
What is a Trial Balance?
A trial balance is a report that lists the balances of all general ledger accounts of a company at a certain point in time. The accounts reflected on a trial balance are related to all major accounting items, including assets, liabilities, equity, revenues, expenses, gains, and losses. It is primarily used to identify the balance of debits and credits entries from the transactions recorded in the general ledger at a certain point in time.
Below is an example of a Company’s Trial Balance:
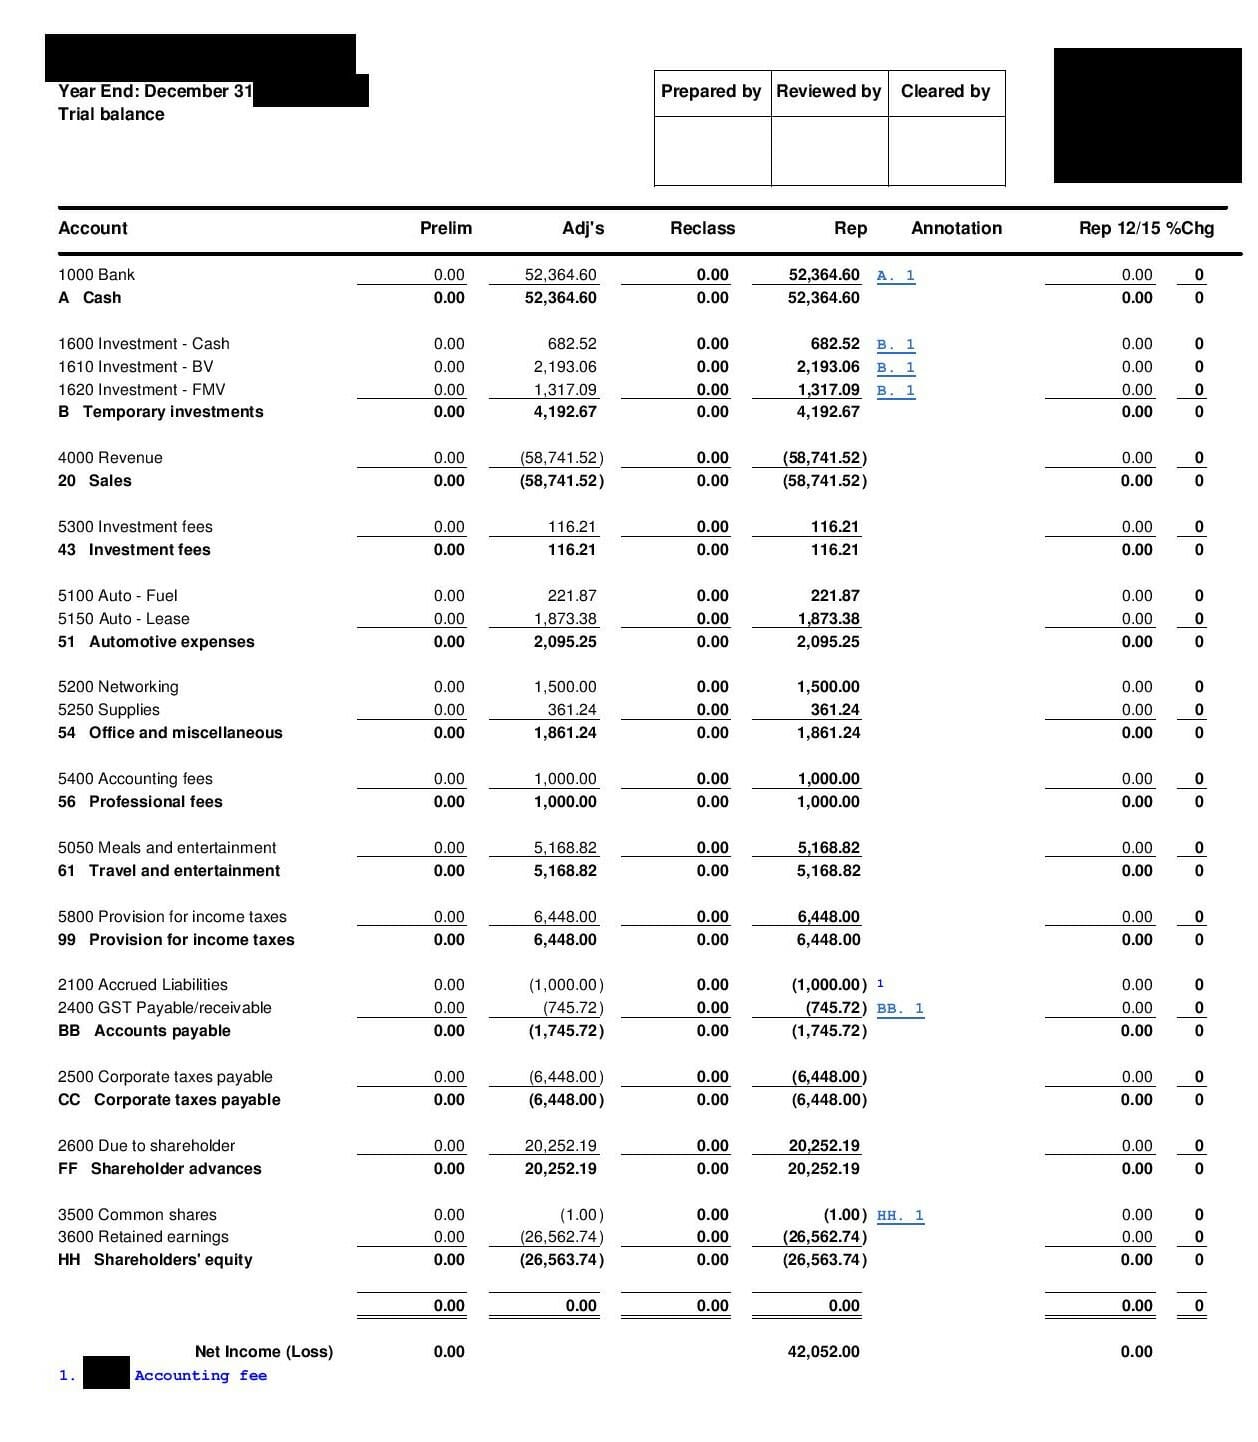
What Does a Trial Balance Include?
A trial balance includes a list of all general ledger account totals. Each account should include an account number, description of the account, and its final debit/credit balance. In addition, it should state the final date of the accounting period for which the report is created. The main difference from the general ledger is that the general ledger shows all of the transactions by account, whereas the trial balance only shows the account totals, not each separate transaction.
Finally, if some adjusting entries were entered, it must be reflected on a trial balance. In this case, it should show the figures before the adjustment, the adjusting entry, and the balances after the adjustment.
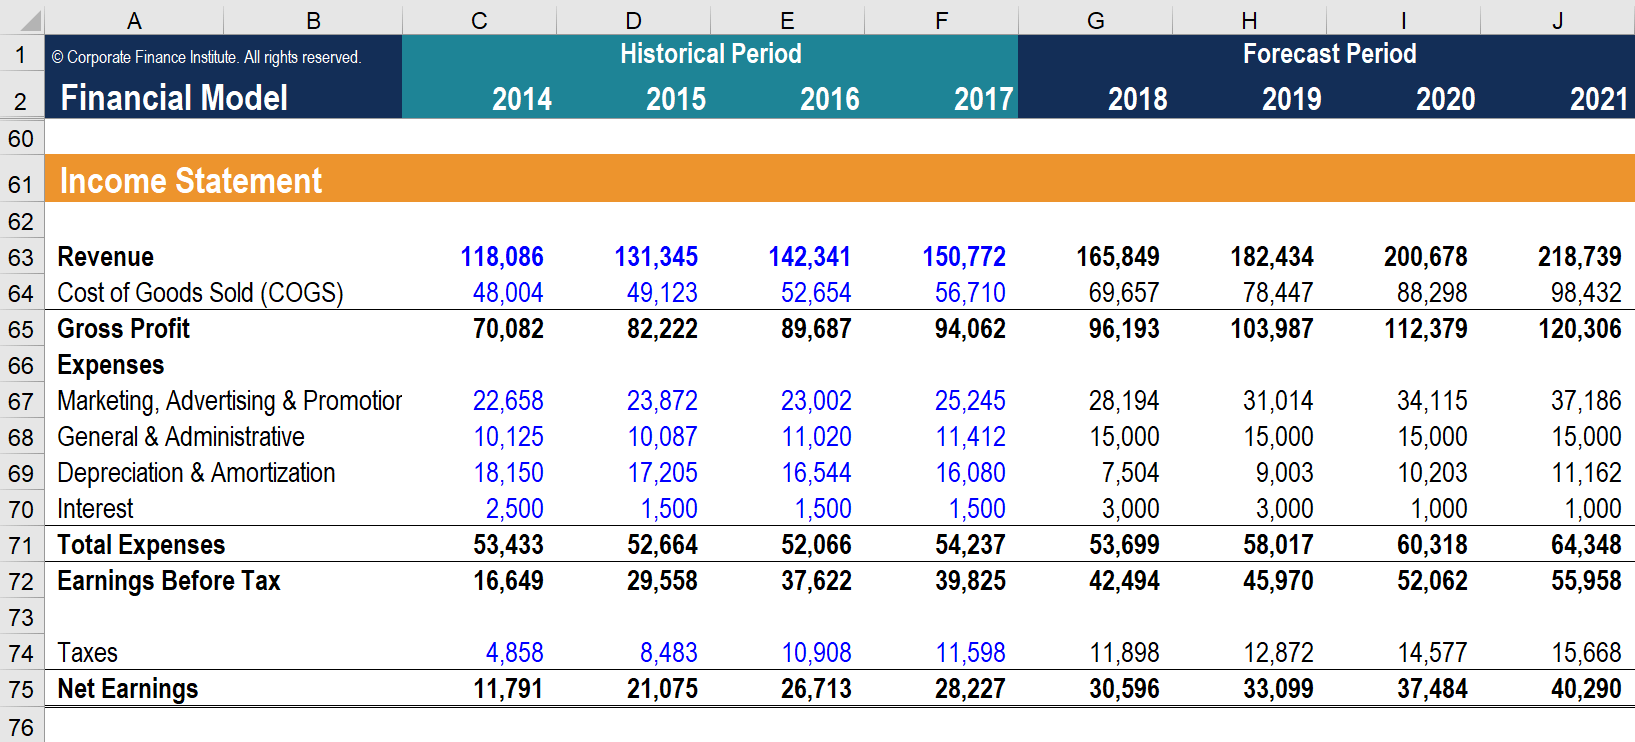
What is the Income Statement?
The Income Statement is one of a company’s core financial statements that shows their profit and loss over a period of time. The profit or loss is determined by taking all revenues and subtracting all expenses from both operating and non-operating activities.
The income statement is one of three statements used in both corporate finance (including financial modeling) and accounting. The statement displays the company’s revenue, costs, gross profit, selling and administrative expenses, other expenses and income, taxes paid, and net profit in a coherent and logical manner.

The statement is divided into time periods that logically follow the company’s operations. The most common periodic division is monthly (for internal reporting), although certain companies may use a thirteen-period cycle. These periodic statements are aggregated into total values for quarterly and annual results.
This statement is a great place to begin a financial model, as it requires the least amount of information from the balance sheet and cash flow statement. Thus, in terms of information, the income statement is a predecessor to the other two core statements.


No comments:
Post a Comment